By the AZFPI Board
Part II – Potential Impacts of Utility-Scale Solar in Yavapai County
This is the second part in a two-part series about proposed utility-scale solar and battery storage farms in Yavapai County
 Yavapai County’s Development Services staff has drafted a utility-scale solar ordinance to regulate the construction, operation, and decommissioning of large, utility-scale solar farms,1 battery storage facilities, and associated transmission lines. The ordinance will be discussed for the fourth time by the BOS on November 6, 2024. In Arizona, only transmission lines are regulated by the Corporation Commission, but only after they are connected. Cities, towns, and counties are left to fend for themselves to determine appropriate land use, location, size, monitoring, and decommissioning requirements for utility-scale solar.
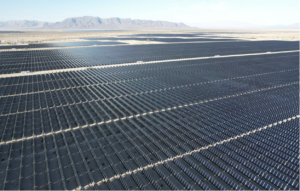
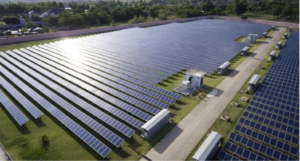
As stated in “Part I” of this article, three utility-scale solar facilities totaling over 10,000 acres have been approved or are pending approval in Yavapai County. This includes the 1,116-acre 1874 95 MW (megawatt) solar farm located south of Highway 89A east of Fain Road (approved), the proposed 4,400-acre 450 MW Dugas farm located north of the I17/Highway 69 junction, and the proposed 5,000-acre 360 MW farm located south of Perkinsville road and partially included in the Town of Chino Valley.
Impact on Native Plant and Wildlife Species, and Groundwater from Utility-Scale Solar Facilities
 First is the sheer size and visual impact of a utility-scale solar farm against a beautiful natural landscape such as Yavapai County’s. During construction, sites are typically cleared of all vegetation resulting in long-term effects on ⎯ and possible displacement of ⎯ native plant and wildlife species.2 Throughout the life of these projects, the sites must be maintained with little to no significant vegetation to ensure the efficacy of the solar panels. This can result in a significant increase in soil erosion. Much like deforestation, this can be disastrous for local ecosystems over the long run.3 Additionally, the impermeable design of the panels alters natural drainage channels and creates stormwater runoff which must be properly controlled.4
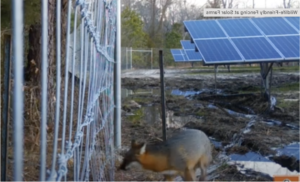
Long-term impacts from utility-scale solar facilities on wildlife include: effects due to noise, predator attraction, and most importantly, habitat fragmentation due to perimeter fencing which ultimately creates barriers to migration and gene flow.5 And these impacts can be exacerbated in arid landscapes where wildlife (and plant) communities are especially sensitive to disturbance.6, 7 A first-in-the-nation (2022) case study examined and quantified the impact of a 640-acre solar project on a southwest Wyoming resident and migratory herd of pronghorn.8 The study documented 69% of the resident Pronghorn lost year-round habitat and had to modify their movements, and 86% of the migratory pronghorn could no longer move through the solar project during migration.9
The study’s solutions included: altering the fencing that surrounded each project, breaking up the project into smaller pieces, site a project in already-disturbed areas, and avoiding important migration routes altogether.10 The problem is these solutions require studying, mapping and understanding of current migration and land-use patterns long before the development and construction of these projects begin.11 National policies and incentives to reduce reliance on fossil fuels must consider local costs, which in Yavapai County may include loss of habitat ⎯ and possibly ecosystem destruction ⎯ associated with our herds of pronghorn, mule deer, and elk.
Laws in Arizona and other western states require developers to mitigate dust, since it can spread health problems like Valley Fever. Consequently, utility-scale solar projects consume vast amounts of groundwater during construction.12 Hauling water is too costly for solar projects encompassing thousands of acres. Instead, project developers prefer to use groundwater during the two-year construction phase. And during the 25-30 year maintenance phase, the projects require water as well since the panels must be kept clean or their efficiency rate drops precipitously. Utility-scale solar projects might not use much water individually, but when added together, they can start to make an impact on our already fragile aquifers in Yavapai County.13
The Heat-Island Effect of Utility-Scale Solar Facilities
Another growing environmental concern is whether large utility-scale solar facilities create a PVHI (photovoltaic heat island) effect. A heat island refers to any area that is relatively hotter than the surroundings but generally refers to human-disturbed areas.14 As with the Urban Heat Island effect, utility-scale power plants could induce a landscape change that reduces albedo15 so that the modified landscape is darker and less reflective, therefore retaining heat.16
Work on PVHI has been mostly theoretical or based upon numerical models, therefore, the effects of utility-scale solar facilities on surface temperature and meteorology are not well understood or clearly documented. For example, while computer models suggested that solar (PV) facilities should decrease ambient temperatures in wildlands at night, a 2016 Barron-Gafford study ⎯ in direct contrast ⎯ found temperatures over a PV facility were regularly 3°C – 4°C warmer.17, 18
Closer to home, another study measured the surface temperature above the 400-acre APS Red Rock PV facility near Casa Grande.19 It found the average daily maximum 1.5-meter air temperature at the array was 1.3°C warmer than at an unmodified desert site.20 The researchers concluded, “To ensure new PV systems are environmentally sustainable, it is important that the impacts of such systems are holistically evaluated.”21 It is noteworthy to contrast the Red Rock facility (400 acres/40MW) with the potential utility-scale solar facilities in Yavapai County: 1874 project (approved 1,116 acres/95MW); Dugas (4,400 acres/450MW); and Draconis (5,000 acres/360MW). It would be reasonable to extrapolate then, the larger the acreage/MW of the utility-scale solar facility, the larger the temperature difference from within the PV array as compared to the surrounding area.
The researchers of the Barron-Gafford study unequivocally concluded additional field data from larger solar projects as to underlying causes of the PVHI effect and potential mitigation strategies are needed. 22 Therefore, it is critical to consider PV heat island effects on Yavapai County’s entire ecosystem before numerous utility-scale solar projects are approved.23
The Fire Danger of Utility-Scale Solar Facilities
There is a severe lack of data on both the risk and prevalence of utility-scale solar farm fires.24 Firetrace International, a leading provider of fire suppression technology headquartered in Scottsdale, conducted an international study on available solar fire data. Its results revealed statistics from the US Fire Administration (USFA) showed solar panel fires25 more than doubled during the period 2015 to 2018.26 This is because the USFA reportedly does not track fires from solar installations ⎯ instead filing them under the ‘other’ category for causes.27
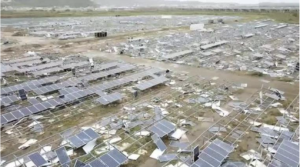
 When a solar panel catches fire, and if there is still light in the environment (the sun is shining), the panel will continue to generate DC current until there is a system failure or a fire suppression intervention. Solar panel fires not only increase the potential for power shortages, but more importantly, risk life and environmental hazards as the panels melt. One example of how this plays out is when a major fire consumed an industrial warehouse in Switzerland (2023) and sharp pieces of solar panels were released and spread for several miles. The toxic smoke, containing dangerous levels of cadmium and lead from the melted solar panels, contaminated grazing lands and prevented harvesting in the area.28
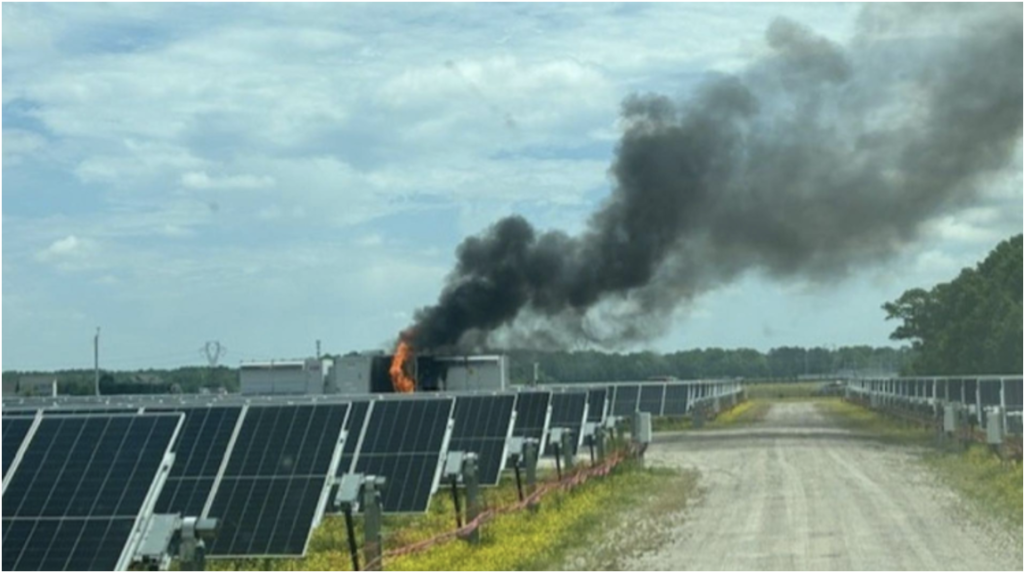
Beyond the PV panels themselves, there is also the risk of fire from the battery energy storage system (BESS). Due to the intermittent nature of renewable energy, a BESS is built alongside an industrial solar project to store and release electricity when needed. Worldwide deployment of battery storage is increasing rapidly, and according to the Electric Power Research Institute (EPRI), the US has experienced the second most major energy storage-related fires globally from September 2011 to July 2023.29 A report issued by Firetrace International reveals insurers warn the use of lithium-ion batteries (most often used with solar farms) are causing “new fire protection challenges.”30, 31 Two examples of large lithium-ion battery storage fires recently occurred in California. In September, 2024, more than 500 businesses and three schools were evacuated as firefighters sprayed more than 8 million gallons of water onto a solar site in Escondido. In June, 2024 another fire burned for 11 days near San Diego.32 Other examples world-wide are noted in research papers, providing actual evidence of the inherent risk in these energy systems.33
Firetrace International also emphasizes an increasing fire risk to communities with the rapid expansion of utility-scale, high voltage, solar energy and battery energy storage systems. “Solar farm fires result in losses which encompass the entire solar farm with the potential to spread and endanger surrounding communities.”34 The solar industry’s lack of transparency ⎯ and the commercial insurance industry’s willingness to absorb the losses so far ⎯ should not prevent Yavapai County from conducting its own cost-benefit analysis as to the extent of utility-scale solar to be approved within its boundaries. At the very least, solar project owners/operators must conduct fire training sessions with first responders to identify best practices for fire suppression and to address the potential risks to both public health and the environment.
The Waste-Management Issue of Utility-Scale Solar Facilities
The composition and end-of-life of the PV solar panels are other aspects to consider when assessing the amount of utility-scale solar facilities to be approved in Yavapai County. Solar panels can contain toxic chemicals including cadmium telluride, copper indium selenide, cadmium gallium (di)selenide, copper indium gallium (di)selenide, hexafluoroethane, lead, and polyvinyl fluoride.35 The Environmental Protection Agency (EPA) cannot definitively say if all solar panels are (or are not) hazardous waste.36 Rather, the EPA places the onus on the individual manufacturer of the solar panel to determine if its panels are hazardous by requiring the company to perform its own appropriate tests, or to use generator knowledge.37 Unfortunately, this kind of self-reporting is problematic, since according to the International Energy Agency (IEA), China accounts for around 80 percent of global solar cell production.38 If the panels are deemed hazardous, they must be transported and disposed of under the Resource Conservation and Recovery Act.39
 Where the levels of toxicity in the solar panel become consequential is at the panel’s end-of-life and ultimately, the solar project’s decommission.40 The industry’s standard life span for solar panels is about 25 to 30 years.41 The International Renewable Energy Agency forecasts that about 80 million metric tons of decommissioned solar panels could accumulate globally by 2050.42 Part of the problem with the accumulating waste is that solar panels are both complicated and expensive to recycle. One of the largest photovoltaic providers, an American manufacturer, has long “offered” recycling for its products.43 At the current capacity, however, it costs anywhere from $12–$30 to recycle one panel. Sending that same panel to a landfill costs a mere $1–$2. 44
Some in the industry believe one day recycling costs could be so low that everyone will recycle solar panels. Others are not so optimistic, believing recycling will have to be mandated because it won’t ever be economical. But currently, there are no federal regulations to mandate solar panel recycling. 45 Last year in Arizona, the governor vetoed legislation requiring owners of utility-scale solar projects, to not only have a decommissioning plan in place, but also to post a bond (essentially insurance) to cover decommissioning costs if their solar company goes bankrupt or they otherwise try to walk away.46 The failure of this legislation, unfortunately, leaves our municipalities and county governments to draft their own patchwork decommission plans. As utility-scale projects are approved, the expected surge of decommissioned panels is an issue that must be dealt with proactively so Yavapai County residents do not see landfills overrun with solar waste in the future.
Social Costs of Utility-Scale Solar Facilities
During the last decade, wind, solar, nuclear, and fossil fuels have all received substantial federal subsidies ⎯ totaling between $13 billion and $37 billion.47 Energy subsidies for nuclear and fossil fuels are concentrated on research and development (i.e. drilling exploration), while wind and solar industries depend on subsidies to a far greater degree for their operating revenue.48 During the last decade, the actual dollar and cents per megawatt-hour (MWh) subsidies received were: natural gas and oil $.39; coal $.73; and nuclear $1.93. Meanwhile, wind received $18.86 for every MWh of power it produced, and solar received $82.46.49 This astronomical difference increases the return on investment for owners of these renewable energy projects far and above what they would earn by just selling the electricity.50 No wonder utility-scale solar projects have become the next gold rush of the Wild West as major corporations, or groups of Silicon Valley investors, chase these subsidized profits.
 In addition to subsidy windfalls, utility-scale solar facilities can have significant impacts on a local community’s land use. It seems the high public support for solar energy use in broad national and statewide surveys (between 80%-93% of respondents support solar), does not necessarily translate into local support at the project level.51 This decline in support comes despite solar corporations dangling promises to politicians and citizens alike of community economic development,52 tax payments,53 or tax revenues for schools. Local surveys show that residents prefer solar projects be sited at least one to five miles from cultural, and recreational areas, up to 11 miles away from wildlife migration routes or breeding grounds, and at least 5 miles away from their home. 54 But community support erodes further when residents learn that once a utility-scale solar project generates more electricity than needed to fill local demand, the power is sold elsewhere. These arrangements are perceived by residents as a “distributive injustice.” 55 In other words, the community bears most of the burden of energy production ⎯ yet reaps little to none of the benefit.
Here in Yavapai County, a similar scenario of “distributive injustice” would likely play out with the proposed solar energy production. New APS56 industrial customers coming online include semi-conductor plants (TSMC & Intel),57 and industrial distribution and data center customers located in Chandler, Buckeye, Casa Grande, and along the Route 303 corridor areas ⎯ not in Yavapai County. APS projects that electricity demand will jump from 3% in 2023 to 34%, driven primarily by their large industrial customers.58 APS will assuredly buy electricity from Yavapai’s proposed Dugas or Draconis solar projects ⎯ or whoever else can supply energy to the grid ⎯ to meet their projected 1.8-GW in load growth over the next five years.59
The question for Yavapai County remains: how does the board maintain the delicate balance between the role a utility-scale solar project plays in the transition to renewable electricity versus its lasting negative effects on a local community and ecosystem? The County must take its time in crafting an ordinance mitigating the negative impacts such as: facility size, siting, proximity to neighborhoods and recreational areas, fire mitigation requirements, groundwater protection, decommissioning, and ongoing maintenance. The County must consider the potential for projects located in city boundaries and regulated by those cities along with the effect of the siting of multiple solar facilities contiguous to each other. Above all, the county must take a regional leadership role in working with cities to craft compatible ordinances.
REFERENCES
1 Ground-based, utility-scale solar panel installations used for electricity generation of 1-MW or greater are commonly referred to as “solar farms.” (March 2024). www.nrcs.usda.gov
2 Planning for Utility Scale Solar Facilities https://w1.planning.org/pas/memo/2019/sep/
4 Without a stormwater (SWP) and erosion/sediment control (ESC) plans in place, land degradation, not limited to gullies, the transport of sediment, and proliferation of noxious and invasive weeds, result. Planning for Utility Scale Solar Facilities https://w1.planning.org/pas/memo/2019/sep/
5 Evaluating Potential Effects of Solar Power Facilities on Wildlife from an Animal Behavior Perspective https://conbio.onlinelibrary.wiley.com/doi/full/10.1111/csp2.319
7 While habitat within utility-scale solar projects is completely lost because of the required security fencing, other forms of energy development (i.e. natural gas, wind, oil) typically remain traversable to large mammals. Trade-offs between utility-scale solar development and ungulates on western rangelands. https://esajournals.onlinelibrary.wiley.com/doi/10.1002/fee.2498
8 Pronghorn appear especially vulnerable to utility scale solar impacts because they prefer flat, open rangeland –habitats also ideal for solar development. As a wide-ranging species, Pronghorn are more susceptible to linear barriers (such as roads and fences) and fragmentation affects them more than other ungulates (hoofed mammals). https://wyofile.com/report-industrial-solar-disrupts-big-game-movements/
9 The 640-acre industrial solar facility affected migrations which extended up to 225 km (140 miles) away. Trade-offs between utility-scale solar development and ungulates on western rangelands. https://esajournals.onlinelibrary.wiley.com/doi/10.1002/fee.2498
10 Same.
11 Given how quickly utility scale solar projects can be constructed, the authors of the case study suggest state and federal agencies preemptively monitor ungulate movement and distribution in regions where solar development is anticipated. https://esajournals.onlinelibrary.wiley.com/doi/10.1002/fee.2498
12 Utility-scale solar farms bloom in California desert. https://www.kisters.net/utility-scale-solar-farms-bloom-in-california-desert/;
13 In a 2023 environmental assessment for recently approved solar projects on public lands in CA, the US Bureau of Land Management found that even if an aquifer wasn’t being overused, the solar project “may adversely affect operation of nearby wells.” Solar Is Booming in the California Desert, if Water Issues Don’t Get in the Way. https://insideclimatenews.org/news/26062023/solar-water-desert-center-california/#:~:text=Even%20if%20it%20wasn%27t,20%2C000%20acre%2Dfeet%20a%20year;
14 Glossary of Meteorology (2019) “Urban Heat Island” American Meteorological Society
15 Albedo is the ability of a surface to reflect the light it receives. It is measured on a scale of 0 to 1. Dark surfaces have a low albedo while lighter surfaces have a higher albedo. In nature, untouched land formations such as green forests and fields, usually have higher albedo values. Albedo in solar panels usually convert 16.67% of the absorbed sunlight to direct current; the rest is dissipated as heat. https://www.weamerisolar.eu/albedo-in-solar-panels/#:~:text=Albedo%20in%20Solar%20panels%20usually,is%20the%20zero%20to%20one
16 Same.
17 Temperatures were monitored for over one year within a one-square kilometer area at: a natural desert ecosystem, the traditional built environment (parking lot surrounded by commercial buildings), and a 1MW PV power plant. The researchers conclude, “The results presented here demonstrate that the PVHI effect is real and can significantly increase temperatures over PV power plant installations relative to nearby wildlands.” The increase in temperature ranged between (5.4°F – 7.2°F). Barron-Gafford, G. A. et al. The Photovoltaic Heat Island Effect: Larger solar power plants increase local temperatures. https://www.nature.com/articles/srep35070.
18 Another study showed “a clear decline of air temperatures as a function of distance from the perimeter of the solar farm, with the temperatures approaching the ambient temperature (within 0.3°C), at about 300 m away.” (What this translates into is that ⎯ from a distance of over three football fields away from the PV facility ⎯ the daily temperature was still .54°F higher than the surrounding area. The researchers state specifically, “However, this temperature difference does imply that the array is influencing air temperature downwind of the array. The downstream effects of PV arrays should be explored further with additional observations and modeling.”) The researchers conclude: analysis of 18 months of data showed that in most days, the solar array was completely cooled at night, and thus, it is ‘unlikely’ that a heat island effect could occur. Yet the study’s authors also concede additional field data from larger solar projects are needed to see if the increase in the size of the solar farm would “similarly not affect the temperature of the surroundings.” First Solar, the largest manufacturer of solar panels in the U.S., supplied the data for this study. Fthenakis, et al., Analysis of the Potential for a Heat Island Effect in Large Solar Farms. (2013) https://apps.psc.wi.gov/ERF/ERFview/viewdoc.aspx?docid=404795
20 The researchers concluded, “This study has shown the PV arrays can impact air temperature when placed above high albedo desert, indicating that environmental assessment of new utility-scale PV array could include an assessment of possible local surface climate impacts. The average daily maximum 1.5-m air temperature within the array was 2.34°F warmer than at an unmodified desert site. Broadbent, et. al., The Observed Effects of Utility-Scale Photovoltaics on Near-Surface Air Temperature and Energy Balance https://journals.ametsoc.org/view/journals/apme/58/5/jamc-d-18-0271.1.xml
21 In the interest of full disclosure: the Redrock study found average daily maximum 1.5-m air temperature within the array was 1.3°C warmer than at an unmodified desert site. The authors stated, “Our daytime air temperature results at 1.5 m are consistent with the Barron-Gafford Study who also observed a daytime PVHI (1.5°C) at a utility-scale PV array in southern Arizona. However, Barron-Gafford Study observed a large nocturnal PVHI (3.0°–4.0°C). Our results indicate an average nocturnal PVHI of 0.5°C below the modules at a height of 0.4 m and no PVHI effect at 1.5 m. Direct comparison of results with the Barron-Gafford Study is difficult because they do not report the height of their air temperature measurements. Regardless of measurement height, our nocturnal PVHI results are not consistent with theirs.” The Observed Effects of Utility-Scale Photovoltaics on Near-Surface Air Temperature and Energy Balance Broadbent, et. al., The Observed Effects of Utility-Scale Photovoltaics on Near-Surface Air Temperature and Energy Balance https://journals.ametsoc.org/view/journals/apme/58/5/jamc-d-18-0271.1.xml
22 The researchers state, “More detailed measurements of the underlying causes of the PVHI effect, potential mitigation strategies, and the relative influence of PVHI in the context of the intrinsic carbon offsets from the use of this renewable energy are needed.” Barron-Gafford, G. A. et al. The Photovoltaic Heat Island Effect: Larger solar power plants increase local temperatures. https://www.nature.com/articles/srep35070. Chinese researchers, using remote satellite sensing data gathered from 116 solar fields (SFs) around the world, provided new observational evidence for the impacts of SFs on albedo, vegetation, and land surface temperature (LST). Their results revealed “significant land surface cooling, especially during the daytime, and a mostly negative impact on albedo and vegetation.” Specifically, the authors concluded at the SF sites, overall results show “a strong cooling in daytime LST (-0.49 K) and weak cooling in nighttime LST (-0.21 K).” However, a more detailed review of their results revealed 19% of those SFs showed daytime warming and 29% of those SF showed nighttime warming as well ⎯ a clear indication of PVHI. The researchers also state, “Our results indicated that the impacts of SFs were complex and variable. Both SF characteristics and environmental factors were key drivers of . . . the variability of the SF impacts, but there was still large unexplained variability that requires further investigation of other factors not considered here . . . Specifically, land-surface temperature (LST) impacts exhibited considerable variability, probably reflecting the heterogeneity in SF characteristics and environmental conditions.” Zhengjie Xu, Yan Li, Yingzuo Qin, Eviatar Bach, A global assessment of the effects of solar farms on albedo, vegetation, and land surface temperature using remote sensing, (January, 2024), https://www.sciencedirect.com/science/article/pii/S0038092X23008320
23 In conducting 54 interviews with a broad set of stakeholders including residents, officials and developers at seven large-scale solar sites across the U.S., researchers focused on identifying residents’ most common concerns. One resident in Arizona noted, “The temperature has gone up so much that the trees do not get a frost now over there, and they’ve died.” Good fences make good neighbors: Stakeholder perspectives on the local benefits and burdens of large-scale solar energy development in the United States. (2024) https://www.sciencedirect.com/science/article/pii/S2214629623004358#bb0510
24 The solar industry under-reports cases when fires are contained by a solar installer or the company without fire department assistance. https://www.firetrace.com/solar-farm-fire-risk-report?hsCtaTracking=bc5cccbd-1a32-4c60-a6d9-d3a88914646b%7Cca81f5c4-8c05-48a6-a4b3-2e5d03f56c10&__hstc=54619444.495d0e9d64827f9e6aed25497b04eaf0.1725380880523.1725380880523.1725380880523.1&__hssc=54619444.4.1725380880523&__hsfp=1236775994&hsutk=495d0e9d64827f9e6aed25497b04eaf0&contentType=standard-page.
25 To be precise, the fire rarely begins with the solar panel itself. Rather, the cables and connectors going into the panel are a common place the fires start. https://www.firetrace.com/fire-protection-blog/what-happens-when-a-solar-farm-catches-on-fire
26 One third of these solar fires were blazes recorded by USFA during the period 2015-2018 occurred in California, Arizona and Nevada. https://www.firetrace.com/solar-farm-fire-risk-report?hsCtaTracking=bc5cccbd-1a32-4c60-a6d9-d3a88914646b%7Cca81f5c4-8c05-48a6-a4b3-2e5d03f56c10&__hstc=54619444.495d0e9d64827f9e6aed25497b04eaf0.1725380880523.1725380880523.1725380880523.1&__hssc=54619444.4.1725380880523&__hsfp=1236775994&hsutk=495d0e9d64827f9e6aed25497b04eaf0&contentType=standard-page.
27 A glaring example of the solar industry’s lack of candor is the U.S. Fire Administration data was made available only following a specific request from an executive at a solar maintenance company. https://www.firetrace.com/solar-farm-fire-risk-report?hsCtaTracking=bc5cccbd-1a32-4c60-a6d9-d3a88914646b%7Cca81f5c4-8c05-48a6-a4b3-2e5d03f56c10&__hstc=54619444.495d0e9d64827f9e6aed25497b04eaf0.1725380880523.1725380880523.1725380880523.1&__hssc=54619444.4.1725380880523&__hsfp=1236775994&hsutk=495d0e9d64827f9e6aed25497b04eaf0&contentType=standard-page. To counter the argument an increase in solar construction would correspond to an increase in fires, statistics from the Australian PV Institute show, while the increase in PV installations in the country during the period 2018 – 2020 was less than three-fold, data from Fire and Rescue New South Wales (NSW) showed there was a six-fold increase in the number of solar fires during that same period. https://www.smh.com.au/national/nsw/the-irony-s-not-lost-on-me-solar-panel-safety-device-led-to-500- per-cent-rise-in-rooftop-fires-20210129-p56xtp.html
28 https://www.pv-magazine.com/2023/07/17/fire-hits-industrial-building-pv-system-in-switzerland/; https://www.pv-magazine.com/2021/05/26/major-fire-at-solar-powered-warehouse-in-the-netherlands-raises-concerns-among-nearby-residents/; https://www.firetrace.com/fire-protection-blog/what-happens-when-a-solar-farm-catches-on-fire
29 https://storagewiki.epri.com/index.php/BESS_Failure_Event_Database
30 For example, lithium-ion batteries are prone to “thermal runaway” which creates intense heat in seconds and makes a fire extremely difficult to extinguish. Thermal is a runaway chain reaction that results in the battery producing heat more rapidly than it can dissipate. Internal battery temperatures can spike to around 400°C (752°F) in milliseconds, and the intense heat driving the fires make them extremely difficult to extinguish https://www.firetrace.com/fire-protection-blog/us-has-suffered-second-highest-number-of-major-storage-fires?_gl=1*xsj5es*_ga*MVBOYWFIcXVPUXFTd0dMM1YySUNuTWdpcHlUcjBCWGFqbnZUU2UwWi1uWXJNa0hhWHQ3cV9mN3U3V3dXWHZ0aA..*_ga_Y851SYXC9H*MTcyNTczNDEwMC4yLjEuMTcyNTczNTgwOS4wLjAuMA ; https://ul.org/research/electrochemical-safety/getting-started-electrochemical-safety/what-causes thermal#:~:text=Thermal%20runaway%20is%20a%20phenomenon,uncontrollable%2C%20self%2Dheating%20state
31 The Electric Power Research Institute database listed 15 global battery-related “failure events in 2023. https://storagewiki.epri.com/index.php/BESS_Failure_Event_Database
32 https://www.nbcsandiego.com/news/local/lithium-ion-battery-fire-in-escondido-prompts-large-response/3615328/ ; https://www.sandiegouniontribune.com/2024/09/05/fire-at-sdge-battery-storage-facility-in-escondido-prompts-evacuations/ ; https://www.theenergymix.com/battery-storage-fire-in-california-sparks-widespread-safety-concerns/
33 (1) A powerful explosion at an APS lithium-ion battery facility storage seriously injured four Peoria firefighters (April 2019). One firefighter was thrown 70 feet in the air, and another 30 feet. Firefighters outside the hot zone described hearing a loud noise and seeing a jet flame extend at least 75 feet outward and an estimated 20 feet vertically. https://www.peoriatimes.com/news/aps-explosion-a-painful-lesson-on-solar-batteries/article_b798fe06-d75f-11ea-8a40-c3d2edfd21dc.html; https://www.nfpa.org/news-blogs-and-articles/blogs/2020/07/31/arizona-ess-explosion-investigation-and-line-of-duty-injury-reports-now-available
(2) Firefighters (July 2023) battled a fire in a cargo container full of lithium-ion batteries used for storing electricity from a solar farm in the Village of Chaumont in New York State for four days. The batteries burned for two more days. Nearby residents are worried about toxic fumes and contamination of groundwater. https://www.northcountrypublicradio.org/news/story/48280/20230811/solar-battery-fire-in-jefferson-county-raises-concerns-for-the-future
(3) “Big Bessie,” one of Australia’s biggest clean energy storage facilities, catches fire (2023). Authorities warn nearby residents to stay indoors to avoid hazardous fumes. Fire allowed to “burn out.” https://insideevs.com/news/688894/tesla-megapack-battery-fire-queensland-australia/
35 https://interestingengineering.com/science/renewable-energy-paradox-solar-panels-and-their-toxic-waste; https://www.hazardouswasteexperts.com/are-solar-panels-hazardous-waste-are-solar-panels-recyclable/; https://iowasolar.com/dangerous-chemicals-in-solar-panels/
36 A research paper from the Universities of Thailand, Bangladesh, and Malaysia however, unequivocally states solar panels will become a form of hazardous waste when their useful life is over and may harm the environment if they are not recovered or disposed of properly. An overview of solar photovoltaic panels’ end-of-life material recycling. (2019) https://www.sciencedirect.com/science/article/pii/S2211467X19301245
37 The EPA cannot say definitively if all solar panels are or are not hazardous waste; this depends on the leachability of RCRA toxic materials present in the solar panel. It is hazardous waste if it exhibits any of the four characteristics of hazardous waste: (toxicity, ignitability, reactivity, corrosivity). https://www.epa.gov/hw/solar-panel-frequent-questions#Are%20solar%20panels%20hazardous%20waste
39 https://www.epa.gov/hw/solar-panel-frequent-questions#Are%20solar%20panels%20hazardous%20waste
40 Solar decommissioning is the process of deconstructing and removing solar energy facilities, ancillary equipment, and related structures [i.e. solar panels, electric wiring, even access roads, etc.] from a site and restoring it to its previous state so the land may be repurposed for future use. Decommissioning takes place after a solar project has reached the end of its lifespan ⎯ on average after 25 to 30 years of operation. It may also require the project owner/developer to provide financial assurance for the estimated costs of removal and site restoration. https://www.dsireinsight.com/blog/2023/10/27/the-state-of-solar-decommissioning-policy-then-and-now; 50+States+of+Solar+Decommissioning+2023+Snapshot+NCCETC+2024.pdf
42 The same waste disposal problem is looming for other renewable-energy technologies. For example, barring a major increase in processing capability, experts expect that more than 720,000 tons worth of humongous wind-turbine blades will end up in U.S. landfills over the next 20 years. https://hbr.org/2021/06/the-dark-side-of-solar-power
43 https://trellis.net/article/what-will-happen-solar-panels-after-their-useful-lives-are-over/
44 https://hbr.org/2021/06/the-dark-side-of-solar-power; https://interestingengineering.com/science/renewable-energy-paradox-solar-panels-and-their-toxic-waste
45 https://www.dsireinsight.com/blog/2023/10/27/the-state-of-solar-decommissioning-policy-then-and-now; Researchers in other nations such as Thailand, Bangladesh, and Malaysia, have urged their governments to adopt hard line policies to force the manufacturers of solar PV materials to consider the consequence of their products on the environment and manage solar panels’ end-of-life as hazardous waste. An overview of solar photovoltaic panels’ end-of-life material recycling. https://www.sciencedirect.com/science/article/pii/S2211467X19301245
46 https://insideclimatenews.org/news/25012024/inside-clean-energy-decommissioning-solar-plants/. Why decommissioning plans are so critical: the Dugas project estimates its solar project will include approximately a million solar panels at build-out; British Petroleum (Draconis Project) did not respond to AZFPI’s request for information via emails or phone calls. But one could assume since the projects are roughly the same size in area, the number of panels used in construction would be approximately the same.
47 Before the Inflation Reduction Act (IRA), signed by President Joe Biden on August 16, 2022, federal wind and solar subsidies were expected to be $7.4 billion in 2023; after the IRA that figure nearly doubled to $14.6 billion. And from 2023 to 2029 the IRA is expected to “inflate” wind and solar subsidies even higher: from $66 billion to more than $108 billion. Peacock, U.S. Federal Renewable Energy Subsidies are Driving the Energy Transition. https://static1.squarespace.com/static/5f08b9b336577f152f2c5c3e/t/66cf9597cd92d7355853f439/1724880279206/Federal+Renewable+Energy+Subsidies+are+Driving+the+Energy+Transition+Final.pdf Citing: Congressional Budget Office and the U.S. Joint Committee on Taxation
48 Specifically, solar received $34 billion, wind received $37 billion, oil received $25 billion, and gas and coal $13 billion each. Nuclear has received about $15 billion, and hydropower and geothermal have each received around $1.4 billion. Bennett, Ph.D. et al., The Siren Song that Never Ends: Federal Energy Subsidies and Support from 2010 to 2019; (Updated July, 2020) https://lifepowered.org/wp-content/uploads/2020/07/2020-04-RR-Bennett-LP-Federal-Energy-Subsidies-2.pdf
49 Peacock, U.S. Federal Renewable Energy Subsidies are Driving the Energy Transition. https://static1.squarespace.com/static/5f08b9b336577f152f2c5c3e/t/66cf9597cd92d7355853f439/1724880279206/Federal+Renewable+Energy+Subsidies+are+Driving+the+Energy+Transition+Final.pdf
50 Bennett, Ph.D. et al., The Siren Song that Never Ends: Federal Energy Subsidies and Support from 2010 to 2019; (Updated July, 2020) https://lifepowered.org/wp-content/uploads/2020/07/2020-04-RR-Bennett-LP-Federal-Energy-Subsidies-2.pdf
51 Bessette, et al., Good fences make good neighbors: Stakeholder perspectives on the local benefits and burdens of large-scale solar energy development in the United States. (February, 2024) https://www.sciencedirect.com/science/article/pii/S2214629623004358; Crawford, et al., Rallying the anti-crowd: Organized opposition, democratic deficit, and a potential social gap in large-scale solar energy. (August, 2022) https://www.sciencedirect.com/science/article/abs/pii/S2214629622001013
52 The Dugas Solar project will create “an average of 400 full-time jobs during construction.” At the maintenance phase, that number dwindles to 8-10 jobs. British Petroleum (Draconis Project) did not respond to AZFPI’s request for information via emails or phone calls. One can assume, given the solar projects are roughly equal in size, the employment numbers would be similar.
53 One of the claims made by backers of utility-scale solar is the projects will bring needed tax revenues into a community ⎯ but that all depends. If a project has a long-term lease on the land, it will pay less taxes than if it owns the land. If a project is leasing government land, it will pay fewer taxes yet. And to make things even more complicated, if the project owner has facilities in multiple counties, tax collection and distribution becomes the responsibility of the State of Arizona. The Dugas Solar project has said they expect to pay approximately $560,000/year in taxes to Yavapai County when they are operational. But they are located on tax-exempt land (State Land) and may have other operations in Arizona. In truth, the estimated amount of taxes Dugas will actually pay to Yavapai County remains to be seen.
54 Bessette, et al., Good fences make good neighbors: Stakeholder perspectives on the local benefits and burdens of large-scale solar energy development in the United States.(February, 2024) https://www.sciencedirect.com/science/article/pii/S2214629623004358
55 Same.
56 APS obtains power in three ways: 1) builds its own power generators; 2) purchases power from another energy provider (i.e. PG&E in CA); 3) purchases power from an industrial-scale energy supplier through Purchase Power Agreements. A PPA is a long-term contract which allows a company (APS) to purchase renewable energy from a supplier (i.e. Longroad Energy or Lightsource BP) at a fixed rate. A signed PPA provides a steady income stream to the electricity supplier and enables financing for the renewable energy project development. PPAs are now one of the largest drivers of new renewable electricity development in the US.
57 Two of the largest and most energy-intensive pieces of the IT sector’s footprint are: (1) data centers and (2) the large semiconductor factories that serve as the virtual and physical engines respectively of our digital world. Both “hyperscale” data centers and semiconductor “megafactories” are dozens of football fields in length capable and are capable of consuming electricity equivalent to a medium-sized city. Clean Clicks or Dirty Chips? (February 2024) https://stand.earth/wp-content/uploads/2024/02/Clean-Clicks-or-Dirty-Chips-Feb-2024_230224.pdf
58 Same.
59 Same.